Wednesday, January 16, 2013

Best AWK Commands

AWK is a data driven programming language designed for processing text-based data, either in files or data streams. It is an example of a programming language that extensively uses the string datatype, associative arrays (that is, arrays indexed by key strings), and regular expressions. WIKI


1)  List of commands you use most often

history | awk ‘{a[$2]++}END{for(i in a){print a[i] ” ” i}}’ | sort -rn | head

2) Display a block of text with AWK

awk ‘/start_pattern/,/stop_pattern/’ file.txt
I find this terribly useful for grepping through a file, looking for just a block of text. There’s “grep -A # pattern file.txt” to see a specific number of lines following your pattern, but what if you want to see the whole block? Say, the output of “dmidecode” (as root):
dmidecode | awk '/Battery/,/^$/'Will show me everything following the battery block up to the next block of text. Again, I find this extremely useful when I want to see whole blocks of text based on a pattern, and I don’t care to see the rest of the data in output. This could be used against the ‘/etc/securetty/user’ file on Unix to find the block of a specific user. It could be used against VirtualHosts or Directories on Apache to find specific definitions. The scenarios go on for any text formatted in a block fashion. Very handy.

3) Graph # of connections for each hosts.

netstat -an | grep ESTABLISHED | awk ‘{print $5}’ | awk -F: ‘{print $1}’ | sort | uniq -c | awk ‘{ printf(“%s\t%s\t”,$2,$1) ; for (i = 0; i < $1; i++) {printf(“*”)}; print “” }’
Written for linux, the real example is how to produce ascii text graphs based on a numeric value (anything where uniq -c is useful is a good candidate).

4) Check your unread Gmail from the command line

curl -u username:password –silent “https://mail.google.com/mail/feed/atom” | tr -d ‘\n’ | awk -F ” ‘{for (i=2; i<=NF; i++) {print $i}}’ | sed -n “s/\(.*\)<\/title.*name>\(.*\)<\/name>.*/\2 – \1/p”
Checks the Gmail ATOM feed for your account, parses it and outputs a list of unread messages.
For some reason sed gets stuck on OS X, so here’s a Perl version for the Mac:
curl -u username:password --silent "https://mail.google.com/mail/feed/atom" | tr -d '\n' | awk -F '' '{for (i=2; i<=NF; i++) {print $i}}' | perl -pe 's/^(.*)<\/title>.*<name>(.*)<\/name>.*$/$2 - $1/'</code></b>If you want to see the name of the last person, who added a message to the conversation, change the greediness of the operators like this:</p> </div> <div> <b><code>curl -u username:password --silent "https://mail.google.com/mail/feed/atom" | tr -d '\n' | awk -F '<entry>' '{for (i=2; i<=NF; i++) {print $i}}' | perl -pe 's/^<title>(.*)<\/title>.*?<name>(.*?)<\/name>.*$/$2 - $1/'</code></b></div> <h3> 5) Remove duplicate entries in a file without sorting.</h3> <p> <b>awk ‘!x[$0]++’ <file></b></p> <p> Using awk, find duplicates in a file without sorting, which reorders the contents. awk will not reorder them, and still find and remove duplicates which you can then redirect into another file.</p> <h3> 6) find geographical location of an ip address</h3> <p> <b>lynx -dump http://www.ip-adress.com/ip_tracer/?QRY=$1|grep address|egrep ‘city|state|country’|awk ‘{print $3,$4,$5,$6,$7,$8}’|sed ‘s\ip address flag \\’|sed ‘s\My\\’</b></p> <div> <p> I save this to bin/iptrace and run “iptrace ipaddress” to get the Country, City and State of an ip address using the <a rel="nofollow" href="http://ipadress.com/">http://ipadress.com</a> service.</p> <p> I add the following to my script to get a tinyurl of the map as well:</p> <p> URL=`lynx -dump <a rel="nofollow" href="http://www.ip-adress.com/ip_tracer/?QRY=$1%7Cgrep">http://www.ip-adress.com/ip_tracer/?QRY=$1|grep</a> details|awk ‘{print $2}’`</p> <p> lynx -dump <a rel="nofollow" href="http://tinyurl.com/create.php?url=$URL%7Cgrep">http://tinyurl.com/create.php?url=$URL|grep</a> tinyurl|grep “19. http”|awk ‘{print $2}’</p> <h3> 7) Block known dirty hosts from reaching your machine</h3> <p> <b>wget -qO – http://infiltrated.net/blacklisted|awk ‘!/#|[a-z]/&&/./{print “iptables -A INPUT -s “$1″ -j DROP”}’</b></p> <p> Blacklisted is a compiled list of all known dirty hosts (botnets, spammers, bruteforcers, etc.) which is updated on an hourly basis. This command will get the list and create the rules for you, if you want them automatically blocked, append |sh to the end of the command line. It’s a more practical solution to block all and allow in specifics however, there are many who don’t or can’t do this which is where this script will come in handy. For those using ipfw, a quick fix would be {print “add deny ip from “$1″ to any}. Posted in the sample output are the top two entries. Be advised the blacklisted file itself filters out RFC1918 addresses (10.x.x.x, 172.16-31.x.x, 192.168.x.x) however, it is advisable you check/parse the list before you implement the rules</p> <h3> 8) Display a list of committers sorted by the frequency of commits</h3> <p> <b>svn log -q|grep “|”|awk “{print \$3}”|sort|uniq -c|sort -nr</b></p> <p> Use this command to find out a list of committers sorted by the frequency of commits.</p> <h3> 9) List the number and type of active network connections</h3> <p> <b>netstat -ant | awk ‘{print $NF}’ | grep -v ‘[a-z]‘ | sort | uniq -c</b></p> <h3> <b>10) </b>View facebook friend list [hidden or not hidden]</h3> <p> <b>lynx -useragent=Opera -dump ‘http://www.facebook.com/ajax/typeahead_friends.php?u=4&__a=1′ |gawk -F’\”t\”:\”‘ -v RS=’\”,’ ‘RT{print $NF}’ |grep -v ‘\”n\”:\”‘ |cut -d, -f2</b></p> <div> <p> There’s no need to be logged in facebook. I could do more JSON filtering but you get the idea…</p> <p> Replace u=4 (Mark Zuckerberg, Facebook creator) with desired uid.</p> <p> Hidden or not hidden… Scary, don’t you?</p> <h3> 11) List recorded formular fields of Firefox</h3> <p> <b>cd ~/.mozilla/firefox/ && sqlite3 `cat profiles.ini | grep Path | awk -F= ‘{print $2}’`/formhistory.sqlite “select * from moz_formhistory” && cd – > /dev/null</b></p> <p> When you fill a formular with Firefox, you see things you entered in previous formulars with same field names. This command list everything Firefox has registered. Using a “delete from”, you can remove anoying Google queries, for example ;-)</p> <h3> 12) Brute force discover</h3> <p> <b>sudo zcat /var/log/auth.log.*.gz | awk ‘/Failed password/&&!/for invalid user/{a[$9]++}/Failed password for invalid user/{a["*" $11]++}END{for (i in a) printf “%6s\t%s\n”, a[i], i|”sort -n”}’</b></p> <p> Show the number of failed tries of login per account. If the user does not exist it is marked with *.</p> <h3> 13) Show biggest files/directories, biggest first with ‘k,m,g’ eyecandy</h3> <p> <b>du –max-depth=1 | sort -r -n | awk ‘{split(“k m g”,v); s=1; while($1>1024){$1/=1024; s++} print int($1)” “v[s]“\t”$2}’</b></p> <p> I use this on debian testing, works like the other sorted du variants, but i like small numbers and suffixes :)</p> <h3> 14) Analyse an Apache access log for the most common IP addresses</h3> <div title="Click to select this command"> <div> <b>tail -10000 access_log | awk ‘{print $1}’ | sort | uniq -c | sort -n | tail</b></div> <div> <b><br> </b></div> <div> This uses awk to grab the IP address from each request and then sorts and summarises the top 10</div> <h3> 15) copy working directory and compress it on-the-fly while showing progress</h3> <p> <b>tar -cf – . | pv -s $(du -sb . | awk ‘{print $1}’) | gzip > out.tgz</b></p> <div> <p> What happens here is we tell tar to create “-c” an archive of all files in current dir “.” (recursively) and output the data to stdout “-f -”. Next we specify the size “-s” to pv of all files in current dir. The “du -sb . | awk ?{print $1}?” returns number of bytes in current dir, and it gets fed as “-s” parameter to pv. Next we gzip the whole content and output the result to out.tgz file. This way “pv” knows how much data is still left to be processed and shows us that it will take yet another 4 mins 49 secs to finish.</p> <p> Credit: Peteris Krumins <a rel="nofollow" href="http://www.catonmat.net/blog/unix-utilities-pipe-viewer/">http://www.catonmat.net/blog/unix-utilities-pipe-viewer/</a></p> <h3> 16) List of commands you use most often</h3> <p> <b>history | awk ‘{print $2}’ | sort | uniq -c | sort -rn | head</b></p> <h3> <b>17) </b>Identify long lines in a file</h3> <p> <b>awk ‘length>72′ file</b></p> <p> This command displays a list of lines that are longer than 72 characters. I use this command to identify those lines in my scripts and cut them short the way I like it.</p> <h3> 18) Makes you look busy</h3> <p> <b>alias busy=’my_file=$(find /usr/include -type f | sort -R | head -n 1); my_len=$(wc -l $my_file | awk “{print $1}”); let “r = $RANDOM % $my_len” 2>/dev/null; vim +$r $my_file’</b></p> <p> This makes an alias for a command named ‘busy’. The ‘busy’ command opens a random file in /usr/include to a random line with vim. Drop this in your .bash_aliases and make sure that file is initialized in your .bashrc.</p> <h3> 19) Show me a histogram of the busiest minutes in a log file:</h3> <p> <b>cat /var/log/secure.log | awk ‘{print substr($0,0,12)}’ | uniq -c | sort -nr | awk ‘{printf(“\n%s “,$0) ; for (i = 0; i<$1 ; i++) {printf(“*”)};}’</b></p> <h3> <b>20) </b>Analyze awk fields</h3> <p> <b>awk ‘{print NR”: “$0; for(i=1;i<=NF;++i)print “\t”i”: “$i}’</b></p> <p> Breaks down and numbers each line and it’s fields. This is really useful when you are going to parse something with awk but aren’t sure exactly where to start.</p> <h3> 21) Browse system RAM in a human readable form</h3> <p> <b>sudo cat /proc/kcore | strings | awk ‘length > 20′ | less</b></p> <p> This command lets you see and scroll through all of the strings that are stored in the RAM at any given time. Press space bar to scroll through to see more pages (or use the arrow keys etc).</p> <p> Sometimes if you don’t save that file that you were working on or want to get back something you closed it can be found floating around in here!</p> <p> The awk command only shows lines that are longer than 20 characters (to avoid seeing lots of junk that probably isn’t “human readable”).</p> <p> If you want to dump the whole thing to a file replace the final ‘| less’ with ‘> memorydump’. This is great for searching through many times (and with the added bonus that it doesn’t overwrite any memory…).</p> <p> Here’s a neat example to show up conversations that were had in pidgin (will probably work after it has been closed)…</p> <p> <b><code>sudo cat /proc/kcore | strings | grep '([0-9]\{2\}:[0-9]\{2\}:[0-9]\{2\})'</code></b>(depending on sudo settings it might be best to run</p> <p> <b><code>sudo su</code></b>first to get to a # prompt)</p> <h3> 22) Monitor open connections for httpd including listen, count and sort it per IP</h3> <p> <b>watch “netstat -plan|grep :80|awk {‘print \$5′} | cut -d: -f 1 | sort | uniq -c | sort -nk 1″</b></p> <div> <p> It’s not my code, but I found it useful to know how many open connections per request I have on a machine to debug connections without opening another http connection for it.</p> <p> You can also decide to sort things out differently then the way it appears in here.</p> <h3> 23) Purge configuration files of removed packages on debian based systems</h3> <p> <b>sudo aptitude purge `dpkg –get-selections | grep deinstall | awk ‘{print $1}’`</b></p> <div> <p> Purge all configuration files of removed packages</p> <h3> 24) Quick glance at who’s been using your system recently</h3> <p> <b>last  | grep -v “^$” | awk ‘{ print $1 }’ | sort -nr | uniq -c</b></p> <p> This command takes the output of the ‘last’ command, removes empty lines, gets just the first field ($USERNAME), sort the $USERNAMES in reverse order and then gives a summary count of unique matches.</p> <h3> 25) Number of open connections per ip.</h3> <p> <b>netstat -ntu | awk ‘{print $5}’ | cut -d: -f1 | sort | uniq -c | sort -n</b></p> <div> <p> Here is a command line to run on your server if you think your server is under attack. It prints our a list of open connections to your server and sorts them by amount.</p> <p> BSD Version:</p> </div> <div> <b><code>netstat -na |awk '{print $5}' |cut -d "." -f1,2,3,4 |sort |uniq -c |sort -nr</code></b></div> <div> And there you have it killer awk usages. Now I know you might be thinking these are NOT awk commands. Maybe not, but awk was used to filter out data.</div> <div> Did I make a mistake?,</div> <div> did I leave something cool behind?</div> <div> Please feel free to comment.</div> </div> </div> </div> </div> </div> </div> </div>

Tuesday, December 11, 2012

Install and configure IBM IHS

Install IBM IHS on AIX System

1) Create logical file system /IBM (or other name)

2) Download the following installation files from IBM WebSite

- C1G2NML.tar.gz (WebSphere Supplements installation media)

3) Download the following FixPack files from IBM website.

Fixpacks

7.0.0-WS-IHS-AixPPC32-FP0000017.pak

7.0.0-WS-PLG-AixPPC32-FP0000017.pak

4) install IHS silently with root user

- Log on the server as root

- In /IBM/IHS7

gunzip C1G2NML.tar.gz

tar –xvf C1G2NML.tar

- Go to directory /IBM/IHS7/IHS

- Run command "cp responsefile.txt responsefile.txt.bak"

- Edit responsefile.nd.txt and set the following value

-OPT silentInstallLicenseAcceptance="true"

-OPT allowNonRootSilentInstall=false

-OPT installLocation="/IBM/HTTPServer"

-OPT createAdminAuth="true"

-OPT adminAuthUser="ihsadmin"

-OPT adminAuthPassword="ihsadmin"

-OPT adminAuthPasswordConfirm="ihsadmin"

-OPT runSetupAdmin="true"

-OPT createAdminUserGroup=true

-OPT setupAdminUser="ihsadmin"

-OPT setupAdminGroup="ihsgroup"

-OPT washostname="remote_was_host"

Uncomment the following options

-OPT disableOSPrereqChecking="true"

And comment all others options

-          Run the following command to install IHS7.0 server

./install -options "responsefile.txt" -silent

See the log files in wpsuser home directory /home/wpsuser/ihslogs) for the installation status.

-          After installation, go to directory /IBM/HTTPServer/bin, and check IHS version using "versionInfo.sh", we will see the version of HTTP Server is 7.0.0.0, go to directory /IBM/HTTPServer/Plugins/bin, and check WebSphere Plugins version using "versionInfo.sh", we will see the version of WebSphere Plugins version is 7.0.0.0

5)     Install Update Installer 7.0.0.17 on the server

-    Go to Directory /IBM/UPDI/

-    Run the command "gunzip 7.0.0.17-WS-UPDI-AixPPC32.tar.gz" and "tar –xvf 7.0.0.17-WS-UPDI-AixPPC32.tar"

-    Go to Directory /IBM/cd_software/UPDI/UpdateInstaller

-    Run the command "cp responsefile.updiinstaller.txt  responsefile.updiinstaller.txt.bak"

-    Edit the file "responsefile.updiinstaller.txt" and set the following value

-OPT silentInstallLicenseAcceptance="true"

-OPT installLocation="/IBM/WebSphere/UpdateInstaller"

Uncomment the following options

-OPT disableOSPrereqChecking="true"

-OPT disableEarlyPrereqChecking="true"

Comment all other options

-          Run the command "./install -options "responsefile.updiinstaller.txt" –silent" to install update installer

Or run this command to install:

./install -silent -OPT silentInstallLicenseAcceptance=true -OPT allowNonRootSilentInstall=true -OPT disableOSPrereqChecking=true -OPT installLocation=/IBM/WebSphere/UpdateInstaller

-          Go to Directory /IBM/WebSpehre/UpdateInstaller to check Update Installer version, it should be "7.0.0.17

6)     Install IHS and WebSphere Plugins fixpacks using Update Installer

-    Go to Directory /IBM/WebSphere/UpdateInstaller/responsefiles

-    Run the command "cp install.txt installIHS.txt" and "cp install.txt installPLG.txt"

-    Edit installIHS.txt as the following:

-W maintenance.package="/IBM/fixpack/7.0.0-WS-IHS-AixPPC32-FP0000017.pak"

-W product.location="/IBM/HTTPServer"

-    Edit installPLG.txt as the following:

-W maintenance.package="/IBM/fixpack/7.0.0-WS-PLG-AixPPC32-FP0000017.pak"

-W product.location="/IBM/HTTPServer/Plugins"

- Go to Directory /IBM/WebSphere/UpdateInstaller/bin, run the following command to apply the fixpacks

./update.sh -options responsefiles/installIHS.txt –silent

./update.sh -options responsefiles/installPLG.txt –silent

Monitor /IBM/WebSphere/UpdateInstaller/logs/tmp/updatelog.txt for updating status.

-    Go to Directory /IBM/HTTPServer/bin and /IBM/HTTPServer/Plugins/bin, run the command "versionInfo.sh" to check that both version should be 7.0.0.17.

-    After installation, go to /IBM, run the following command to grant the permission
"chmod –fR 755 /IBM/HTTPServer", "chown –fR wasuser:wasgroup /IBM/HTTPServer"

-    Go to /IBM/HTTPServer/conf, edit httpd.conf and update the following values

User wasuser

Group wasgroup

- Go to /IBM/HTTPServer/bin, and run "adminctl start" and "apachectl –k start" to start IHS server.

Configure IHS Web Server on WAS or WPS

After installing IHS Web Server, we need to create a web server on WAS so that the application deployed on WAS server can be mapped to web server.

-          Logon to server WAS_HostServer with user "wasuser", the user is used to run WebSphere Application Server instances

-          Go to directory /IBM/WebSphere/AppServer/bin

-          Download the file "configurewebserver1.sh" from IHS_HostServer, the file is at /IBM/HTTPServer/Plugins/bin

-          Edit the last line configurewebserver1.sh like this:

./wsadmin.sh $PROFILE_NAME_PARAMETER $WSADMIN_USERID_PARAMETER $WSADMIN_PASSWORD_PARAMETER -f $WAS_HOME/bin/configureWebserverDefini

tion.jacl webserver1 IHS '/IBM/HTTPServer' '/IBM/HTTPServer/conf/httpd.conf' 80 MAP_NONE'/IBM/HTTPServer/Plugins' unmanaged webserver1-node  blue-devweb01.mtsallstream.com aix 8008  ihsadmin $IHS_ADMIN_PASSWORD_PARAMETER

I recommend to use "MAP_NONE" to replace "MAP_ALL".

-          Run the shell script

configurewebserver1.sh cellName  userid userpassword ihsadmin

userid and userpassword should be specified if global security is enabled.

-          logon to administrative console, then synchronize the nodes

-          Go to servers->server Types-> web servers, if the web server is running on IHS_Host, then the server status is running

-          if webserver1 status is stopped, we can start the web server1 through administrative console if http admin process is running on blue-devweb01.

-          Make the ihsadmin username and password is entered. Click "webserver1", then click "Remote Web server management" at the right side. assure the port number, username and password are correct

-          Then select "webserver1" and click "Start" button to start web server, the server should be started.

-          Select "webserver1" and click "Generate Plug-in", and then select "webserver1" again and  click "Propagate Plug-in". we may see the following error:

"PLGC0049E: The propagation of the plug-in configuration file failed for the Web servers xxxxxxxxxx

-          the reason why it happened it because the permission issue

-          logon to server IHS_Host with user "wasuser"

-          go to directory /IBM/HTTPServer/Plugins/config/webserver1

-          make sure plugin-cfg.xml permission is 755 or 664

-          go to directory /IBM/HTTPServer/conf

-          edit the conf file admin.conf as following:

User wasuser

Group wasgroup

-          switch to root user

-          Go to directory /IBM/HTTPServer/bin

-          restart admin process: ./adminctl stop and ./adminctl start

-          the issue should be solved.a

WebSphere Application Server 7 Federated Repository Configuration – Microsoft AD configuration

Some people are confusing how to configure the Federated Repository to Connect to Microsoft Active directory LDAP server.  IBM docs do not provide a clean configuration steps.

Here are the steps what I configured Federated Repository to connect to Microsoft Active Directory LDAP

1) Log on to Admin Console and go to Security-Global Security

2) select "Federated Repositor" from drop down list and click "Configure…" button

Global Security

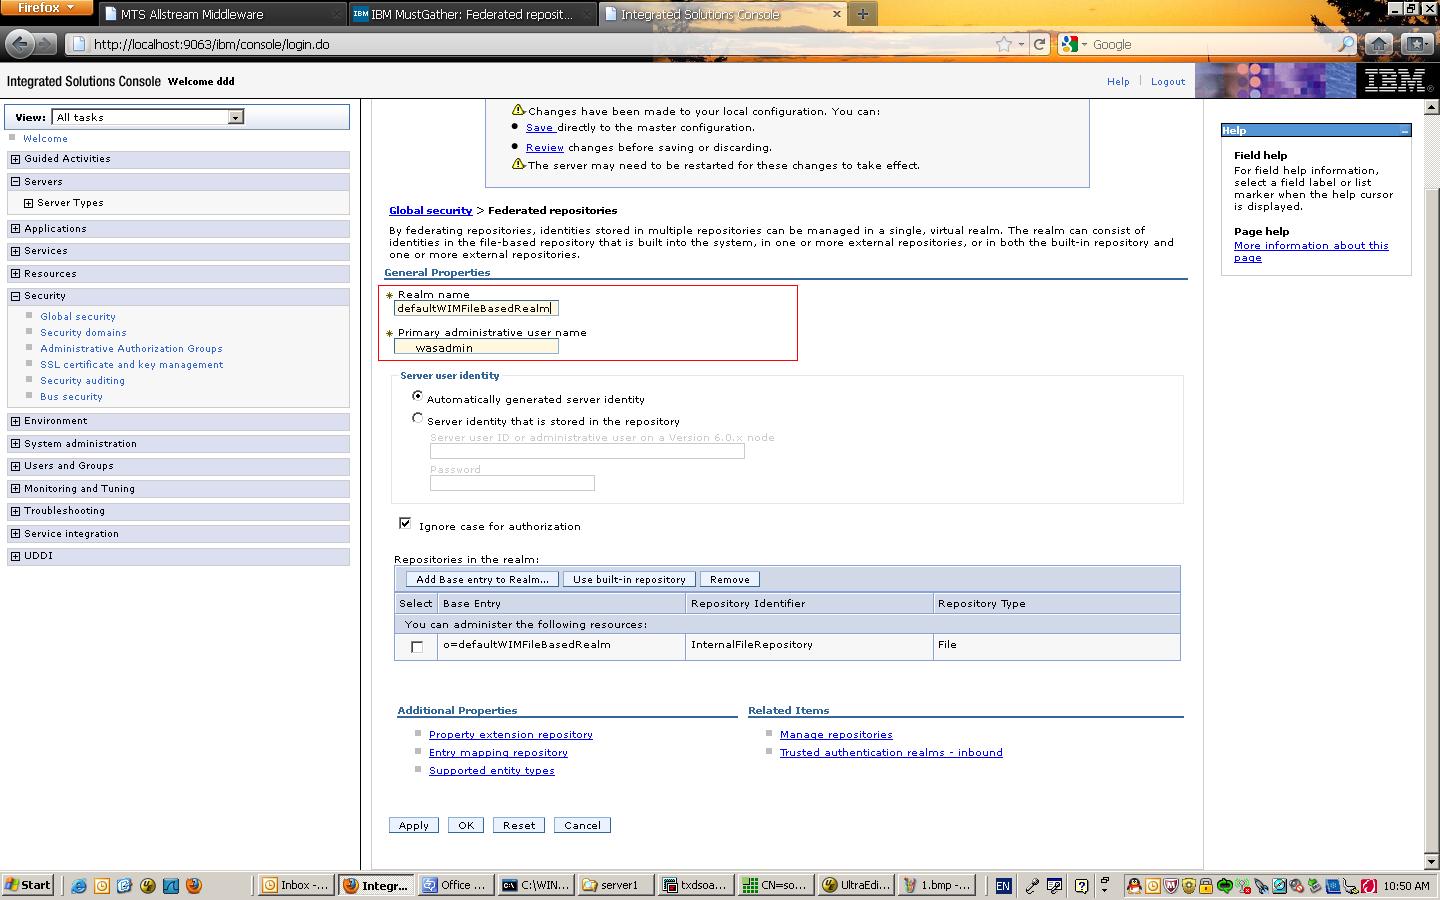
3) Specify a Primary administrative user name. Note: this user name should not be same user in Microsoft AD LDAP

Primary User

4) Click "Add Base Entry to Realm…" button in this page

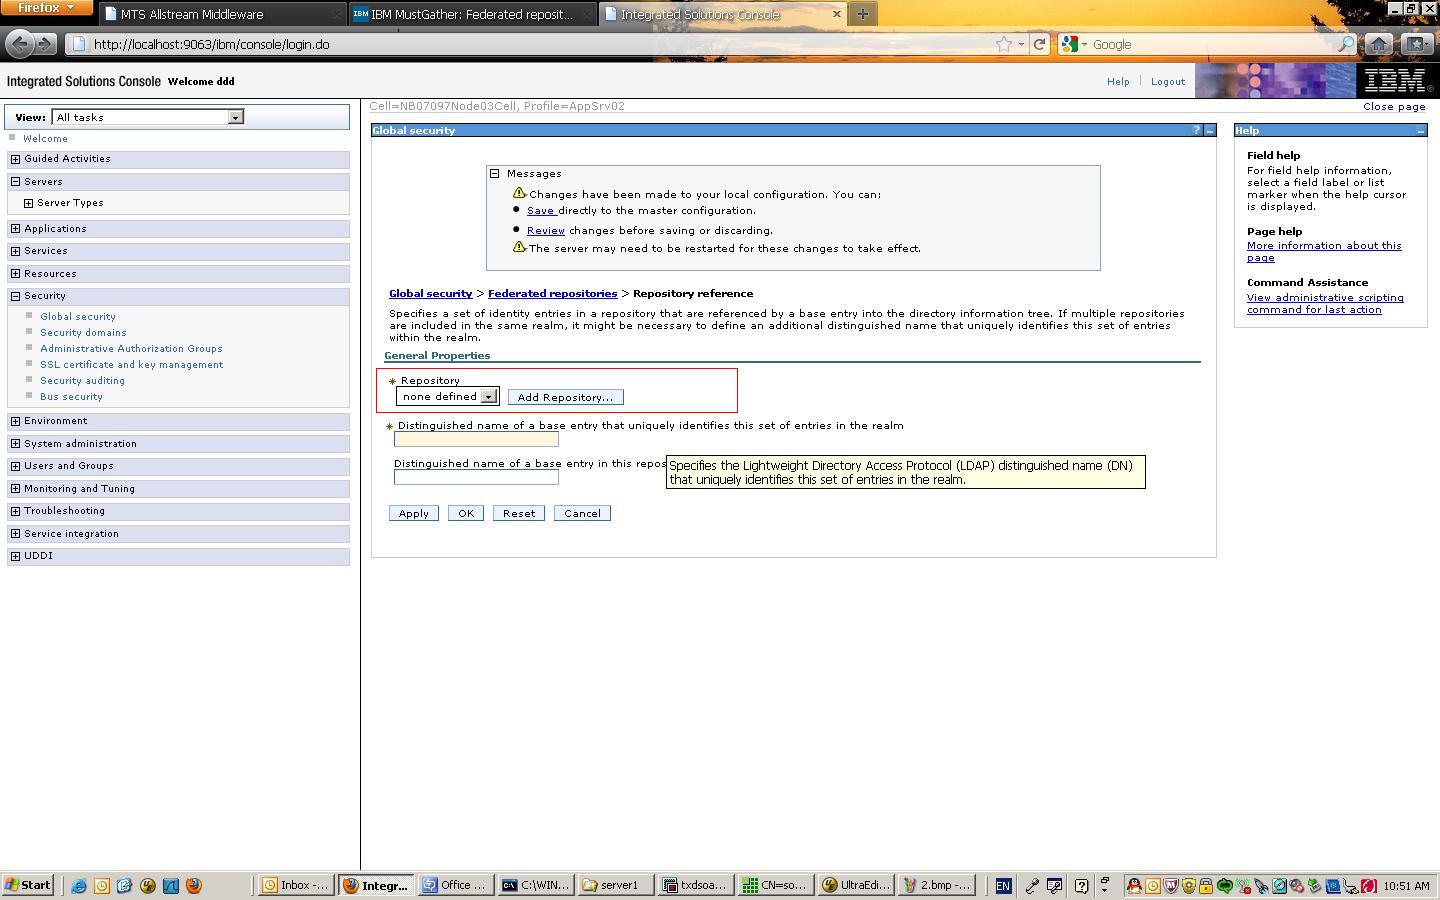
5) click "Add Repository" button

Add Repository

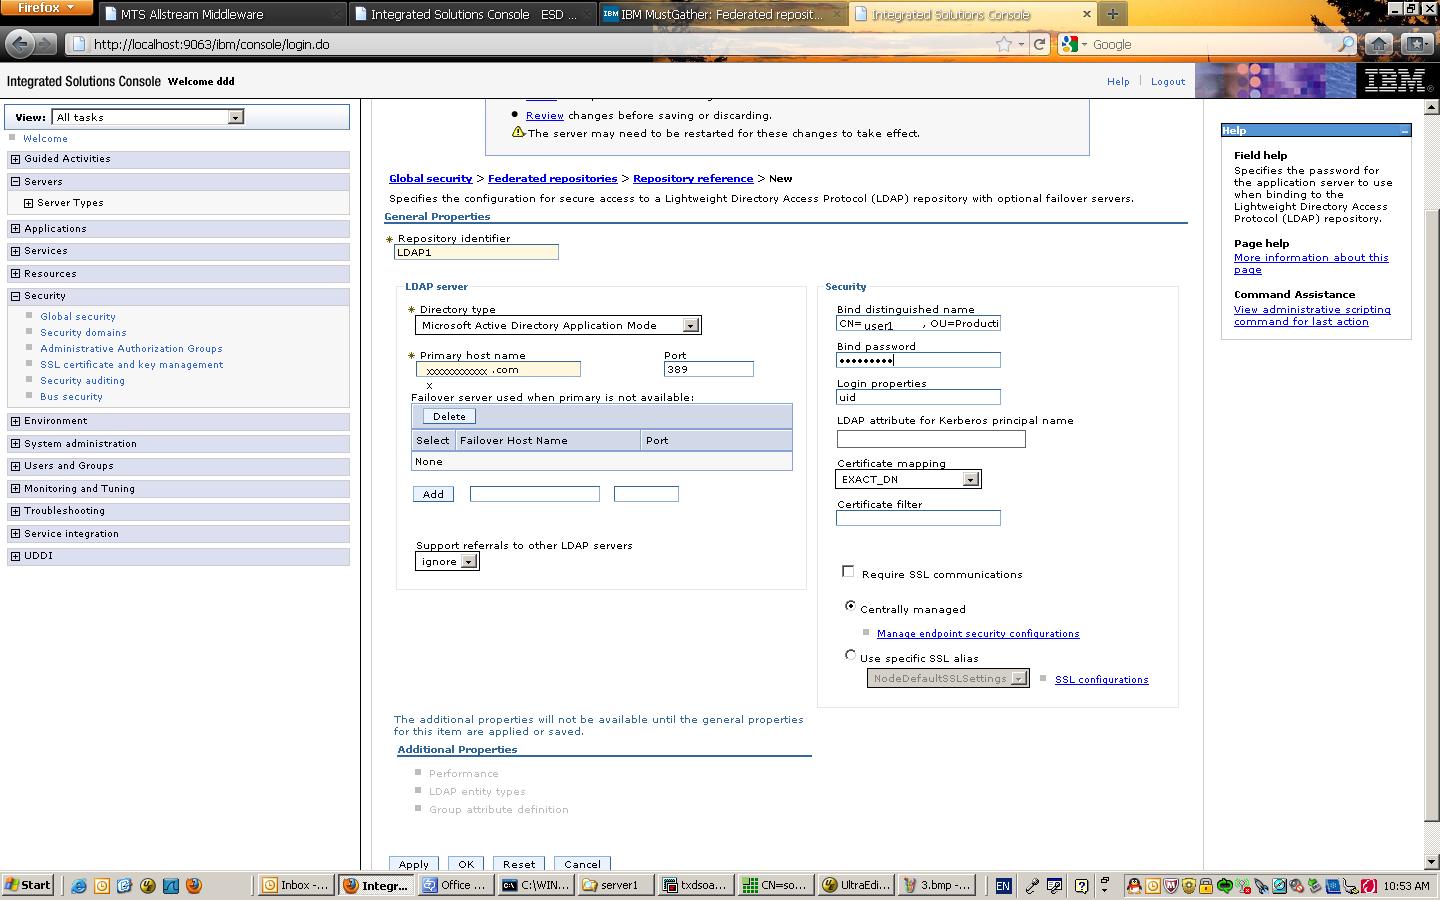
6)  enter the Repository Identifier,  host name, port, binging user, and password, Then click "Apply"

Configuration

7) click "LDAP entity types" link

LDAP Entity Type

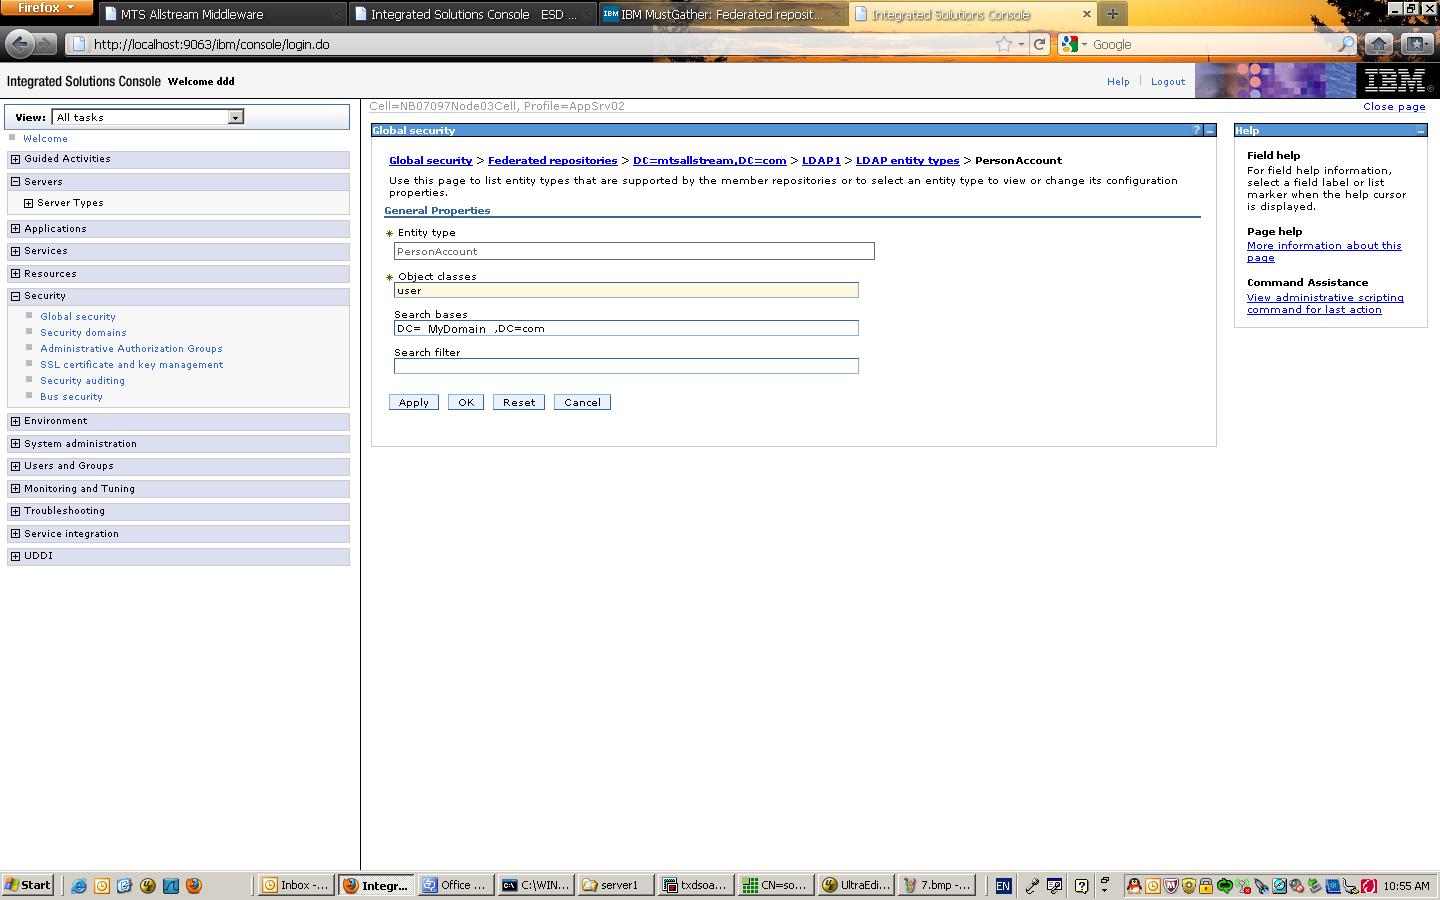
8) then click "PersonalAccount" link, and set the Search base like "DC=mydomain,DC=com", then click "Ok"

Personal Account

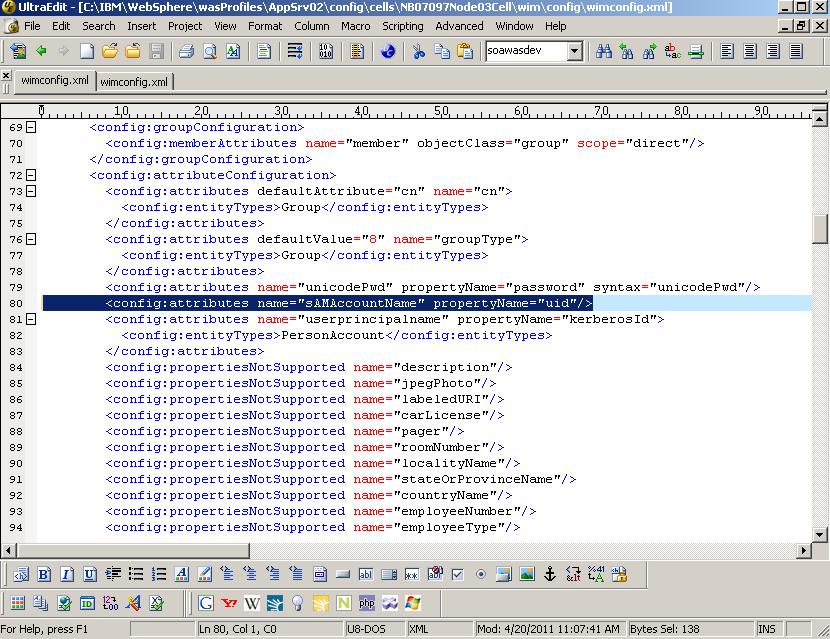
9) this step is very import, find the file named wimconfig.xml at the directory <ProfileDir>/Config/cells/<NodeName>/wim/config, add the highlighted entry in the correct section

WIM Configuration

Most Microsoft active directory use sAMAccountName to authenticate the user, so we need to map sAMAccountName attribute to uid in order to search the user.

After changing the file, we need to restart the server. and then we should be able to find the active directory user from the console.

Thursday, November 29, 2012

HTTP Error Codes and their meaning

Following are the HTTP Error Codes. These Error codes are crucial for troubleshooting various issues with Symantec Endpoint Protection.


You can see these error codes in various logs, such as scm-server-0.log, sylink log, in a Secars test.


If you can interpret the correct meaning of the http error code, you can decide the places to look at for resolving this issue.


These status codes indicate a provisional response. The client should be prepared to receive one or more 1xx responses before receiving a regular response.


* 100 - Continue.

* 101 - Switching protocols.


2xx - Success


This class of status codes indicates that the server successfully accepted the client request.


* 200 - OK. The client request has succeeded.

* 201 - Created.

* 202 - Accepted.

* 203 - Non-authoritative information.

* 204 - No content.

* 205 - Reset content.

* 206 - Partial content.

* 207 - Multi-Status (WebDay).


3xx - Redirection


The client browser must take more action to fulfill the request. For example, the browser may have to request a different page on the server or repeat the request by using a proxy server.


* 301 - Moved Permanently

* 302 - Object moved.

* 304 - Not modified.

* 307 - Temporary redirect.


4xx - Client Error


An error occurs, and the client appears to be at fault. For example, the client may request a page that does not exist, or the client may not provide valid authentication information.


* 400 - Bad request.

* 401 - Access denied. IIS defines several different 401 errors that indicate a more specific cause of the error. These specific error codes are displayed in the browser but are not displayed in the IIS log:

o 401.1 - Logon failed.

o 401.2 - Logon failed due to server configuration.

o 401.3 - Unauthorized due to ACL on resource.

o 401.4 - Authorization failed by filter.

o 401.5 - Authorization failed by ISAPI/CGI application.

o 401.7 – Access denied by URL authorization policy on the Web server. This error code is specific to IIS 6.0.


* 403 - Forbidden. IIS defines several different 403 errors that indicate a more specific cause of the error:


o 403.1 - Execute access forbidden.

o 403.2 - Read access forbidden.

o 403.3 - Write access forbidden.

o 403.4 - SSL required.

o 403.5 - SSL 128 required.

o 403.6 - IP address rejected.

o 403.7 - Client certificate required.

o 403.8 - Site access denied.

o 403.9 - Too many users.

o 403.10 - Invalid configuration.

o 403.11 - Password change.

o 403.12 - Mapper denied access.

o 403.13 - Client certificate revoked.

o 403.14 - Directory listing denied.

o 403.15 - Client Access Licenses exceeded.

o 403.16 - Client certificate is untrusted or invalid.

o 403.17 - Client certificate has expired or is not yet valid.

o 403.18 - Cannot execute requested URL in the current application pool. This error code is specific to IIS 6.0.

o 403.19 - Cannot execute CGIs for the client in this application pool. This error code is specific to IIS 6.0.

o 403.20 - Passport logon failed. This error code is specific to IIS 6.0.


* 404 - Not found.


o 404.0 - (None) – File or directory not found.

o 404.1 - Web site not accessible on the requested port.

o 404.2 - Web service extension lockdown policy prevents this request.

o 404.3 - MIME map policy prevents this request.

* 405 - HTTP verb used to access this page is not allowed (method not allowed.)

* 406 - Client browser does not accept the MIME type of the requested page.

* 407 - Proxy authentication required.

* 412 - Precondition failed.

* 413 – Request entity too large.

* 414 - Request-URI too long.

* 415 – Unsupported media type.

* 416 – Requested range not satisfiable.

* 417 – Execution failed.

* 423 – Locked error.


5xx - Server Error


The server cannot complete the request because it encounters an error.


* 500 - Internal server error.


o 500.12 - Application is busy restarting on the Web server.

o 500.13 - Web server is too busy.

o 500.15 - Direct requests for Global.asa are not allowed.

o 500.16 – UNC authorization credentials incorrect. This error code is specific to IIS 6.0.

o 500.18 – URL authorization store cannot be opened. This error code is specific to IIS 6.0.

o 500.19 - Data for this file is configured improperly in the metabase.

o 500.100 - Internal ASP error.


* 501 - Header values specify a configuration that is not implemented.

* 502 - Web server received an invalid response while acting as a gateway or proxy.

o 502.1 - CGI application timeout.

o 502.2 - Error in CGI application.

* 503 - Service unavailable. This error code is specific to IIS 6.0.

* 504 - Gateway timeout.

* 505 - HTTP version not supported.

Monday, November 26, 2012

WebSphere troubleshooting .....


1. Have an end-to-end view in WebSphere troubleshooting, from browser all the way to the backend system.

2. First, test JVM to see if it is working. Make sure that the JVM is up and running and there is no hang thread. Turn on verbose GC and look into system log and native_std.log for JVM related error message.

3. From the browser, to be if the URL is working. If the return code is 500 internal error, this may be a JVM or plugin issue. If the return code is 404 page not found error, it may well be a web server problem.

4. Try to browse into the transport port of the web server and application server directly. If there URL works, then, you can exclude the web server and application server from the troubleshooting scope.

5. Use “telnet server_name port_name” to test network connectivity and server status or test other components of the system, for example MQ server with a port number of 1470.

6. Look into the access log of the web server to see if any request has actually made to the web sever and not got stuck with the 3DNS or BIG IP. Also look into error logs to see if there are any plugin problems and SITEMINDER issues.

7. If there is high CPU, usually it is bad application code.

8. If there is high memory consumption, create heap dump with kill -3 helps. You can ship the dump to IBM for analysis if your work station does not have enough memory to run the Support Assistance suite of tools.

9. Check connection pool – a frequently seen problem is a bug in the JEE code that does not close the connection after using. This causes a connection leak. Use “telnet server_name 446″ to examine the network connectivity between the WebSphere Application Server and the backend systems. This will also tell you if the server is actually up and running. Sometimes, the piling up of connections is due to a connectivity issue. Use TPV, Introscope, or ITCAM to inspect the connection pool as well as examine system log for connection timeout.

10. It helps tremendously if you have transaction monitoring capability. Then, you know exactly where the transaction got stuck or slows down. Introscope provides this capability, though you need in-depth expertise in Introscope that takes time to build.

11. The capability to monitor user experience and transaction is critical in troubleshooting.

Thursday, November 22, 2012

How to find out JBoss Versions

My group is working on a way to perform C&A on JBOSS. The method discussed here did not work as expected with JBOSS EAP 5.1 and JBOSS AS Community 6.0.1. After poking around a bit I found that the $JBOSS_HOME/bin/run.sh script will tell you the version. For C&A purposes it's nice to have a quick method to get answers so we have been using the following find statement:


find $JBOSS_HOME -name run.sh -exec {} -V \;
grep '^JBoss'

JBoss 5.1.1 (build: SVNTag=JBPAPP_5_1_1 date=201105171607)


Unfortunatily, if you are working with SCAP this method is useless since there is no definition that I am aware of that allows for the execution of a shell script. But you can use the Independent Definition 5.10.1 1/27/2012 ind:xmlfilecontent test to extract the JBoss version from the $JBOSS_HOME/jar-versions.xml:


name: applet.jar

specVersion: 5.1.1

1.1.1 Hot deploy copying jar (in standalone mode, not suggested in domain mode)


The easiest way to hot deploy a driver in standalone mode is to copy the jar into the $JBOSS_HOME/standalone/deployments (don’t forget to read the README.located there!). If you are copying a jdbc 4 compliant driver you will get a message like this into console where you have started the standalone server:


12:59:17,663 INFO [org.jboss.as.server.deployment] (MSC service thread 1-3) Starting deployment of "mysql-connector-java-5.1.15.jar"

12:59:18,191 INFO [org.jboss.as.connector.deployers.jdbc] (MSC service thread 1-3) Deploying non-JDBC-compliant driver class com.mysql.jdbc.Driver (version 5.1)

12:59:18,291 INFO [org.jboss.as.server.controller] (DeploymentScanner-threads - 2) Deployed "mysql-connector-java-5.1.15.jar"1.1.2 Deploy a driver using jboss-admin.sh command line tool

Standalone: Start the server in standalone mode, open another console, launch the jboss-admin.sh tool. Run these commands:


[standalone@localhost:9999 /] connect

Closed connection to localhost:9999

Connected to standalone controller at localhost:9999

[standalone@localhost:9999 /] deploy /dati/drivers/mysql-connector-java-5.1.15.jar

'mysql-connector-java-5.1.15.jar' deployed successfully.You will get an output to server running console identical to one pasted in section 1.1.1.


Domain: Start the server in domain mode, pen another console, launch the jboss-admin.sh tool. Run these commands:


[standalone@localhost:9999 /] connect

Closed connection to localhost:9999

Connected to domain controller at localhost:9999

[domain@localhost:9999 /] deploy --all-server-groups /dati/drivers/mysql-connector-java-5.1.15.jar

'mysql-connector-java-5.1.15.jar' deployed successfully.You will get this output to server running console:


[Server:server-one] 13:07:51,933 INFO [org.jboss.as.server.deployment] (MSC service thread 1-5) Starting deployment of "mysql-connector-java-5.1.15.jar"

[Server:server-two] 13:07:51,934 INFO [org.jboss.as.server.deployment] (MSC service thread 1-6) Starting deployment of "mysql-connector-java-5.1.15.jar"

[Server:server-two] 13:07:52,344 INFO [org.jboss.as.connector.deployers.jdbc] (MSC service thread 1-7) Deploying non-JDBC-compliant driver class com.mysql.jdbc.Driver (version 5.1)

[Server:server-one] 13:07:52,355 INFO [org.jboss.as.connector.deployers.jdbc] (MSC service thread 1-7) Deploying non-JDBC-compliant driver class com.mysql.jdbc.Driver (version 5.1)

[Server:server-two] 13:07:52,441 INFO [org.jboss.as.server.controller] (pool-1-thread-1) Deployed "mysql-connector-java-5.1.15.jar"

[Server:server-one] 13:07:52,441 INFO [org.jboss.as.server.controller] (pool-1-thread-1) Deployed "mysql-connector-java-5.1.15.jar"

Wednesday, October 10, 2012

Script to check the status of application and send email notification if application is down

Script to check the status of application and send email notification if application is down


This Script checks the status of application and send email notification if application is down. Define the application URL in url.properties

#!/usr/bin/bash


PATH=${PATH}:/opt/csw/bin;export PATH


cd /home/charan

date=`date '+%Y%m%d%H%M'`

mdate=`date '+%b-%d(%A)-%Y_%H.%M%p'`

home=/home/charan

logdir=$home/logs/application/$1.app.log$date

emaillist=

if [ $# -ne 1 ] ;

then echo ;

echo "enter env name for the script to execute or pass ALL as argument to check for the status of all envrionment specified in url.properties"

echo

exit 0

fi

echo " Checking application status of $1 Server "

envlist=" DEV SIT UAT "

if [[ $1 == ALL ]]; then

for envvar in $envlist ;

do

PropsPath="/home/ccbuild/charan/url.properties";

URL=`grep "$envvar"= $PropsPath
awk -F= '{print $2}'`

echo " $envvar URL --> $URL "

wget -q -O $logdir $URL

if [ \! -s $logdir ]; then

mailx -s "$envvar Application is DOWN" $emaillist < $logdir rm -rf $logdir fi done fi for env in $envlist ; do if [[ $env == $1 ]]; then PropsPath="/home/charan/url.properties"; URL=`grep "$env"= $PropsPath
awk -F= '{print $2}'` echo " $env URL --> $URL "

wget -q -O $logdir $URL

if [ \! -s $logdir ]; then

mailx -s "$env Application is DOWN" $emaillist < $logdir

rm -rf $logdir

fi

fi

done

rm -rf $logdir


--------------------------------------------------------------


DEV=

SIT=

UAT=

Web server plug-in routing to SAME application in DIFFERENT clusters

Question


If I install the same Web application into more than one WebSphere Application Server cluster, is it possible to configure the Web server plug-in to properly route requests to the application in both clusters?


Cause


The most common use of the WebSphere Application Server Web server plug-in is to load balance requests for an application installed to a single cluster. For that environment you should not use the instructions in this technote.


In some rare cases, you might want to install the exact same application into multiple clusters. The purpose of this technote is to describe how to configure the WebSphere Application Server Web server Plug-in to work properly in that specific case.


Answer


Note: The Web server plug-in does not support load balancing or fail-over between multiple clusters. Also the configuration described below requires manually changing the plugin-cfg.xml file, so you should turn off automatic propagation in the WebSphere Administrative Console so that the plugin-cfg.xml file does not get automatically overwritten.


Yes, it is possible for a single Web server plug-in to properly route requests when the same application is installed into more than one WebSphere Application Server cluster. To make this work you will need to use different hostnames or port numbers for each of the clusters. You will also need to do some manual cut and paste of information in the plugin-cfg.xml file.


The example below shows exactly how to accomplish this.


* The IBM HTTP Server machine is called ihsbox.

* cluster1 has two members c1_member1 and c1_member2.

* cluster2 has two members c2_member1 and c2_member2.

* Both of the member1 appservers are on a machine called was1.

* Both of the member2 appservers are on a machine called was2.


So, for this simple example, it would look like the following:


------ was1 --- cl1_member1

/ \--- cl2_member1

/

ihsbox

\

\------ was2 --- cl1_member2

\--- cl2_member2


If I install my snoop application (context-root /snoop) into both clusters, how is the plug-in supposed to distinguish which ServerCluster to use?


In the plug-in, there are only 3 things that can distinguish between requests:


* hostname

* port number

* URI


For example, these URLs are unique requests that can be routed independently of each other:


http://host1/snoop

http://host1:83/snoop

http://host2/snoop

http://host2:81/snoop


In each of these examples, the URI part /snoop remains the same. It is the hostname or port number that makes the difference.


Back to the example, in Application Server admin, you would create a virtual host called "vhost1" which would have a host alias of host1:80. You would also need to include other host aliases for the internal ports used by appservers in cluster1 (for example: ports 9080, 9081, 9443, 9444). You would use this virtual host (vhost1) in all of the members of cluster1 (cl1_member1 and cl1_member2).


In addition, you would create a virtual host called "vhost2" which would have a host alias of host2:80. You would need to include other host aliases for the internal ports used by appservers in cluster2. I would use this virtual host (vhost2) in all of the members of cluster2 (cl2_member1 and cl2_member2).


In order to maintain session affinity it is essential to use different affinity cookie names for each different cluster. For example, the appservers in cluster1 can use the cookie name "JSESSIONIDC1". And the appservers in cluster2 can use the cookie name "JSESSIONIDC2". By using different cookie names for the different clusters, session affinity will be preserved within each cluster. For information about how to change the cookie names, see Cookie settings in the Information Center.


You must map the application modules to the newly created virtual hosts. Since the same application is installed to both clusters, you will need to map the application modules to both vhosts. However, there currently is a limitation in the Application Server administrative console in that it only allows the application modules to be mapped to a single vhost. Consequently, you must use a trick to map the modules twice and manually copy and paste the configs into a single plugin-cfg.xml file.


Here are the steps to use:


1. Map the application modules to the first vhost (for example: vhost1).


2. Generate the plug-in.


3. From the plugin-cfg.xml file, manually copy the VirtualHostGroup and UriGroup and Route that correspond to vhost1.


4. Map the application modules to the second vhost (for example: vhost2).


5. Generate the plug-in.


6. In the new plugin-cfg.xml file you will see that the VirtualHostGroup and UriGroup for vhost1 are gone, and there are new VirtualHostGroup and UriGroup for vhost2.


7. Manually paste the VirtualHostGroup and UriGroup and Route for vhost1 back into the plugin-cfg.xml file.


8. Save the plugin-cfg.xml file and propagate it to the Web server.


The plugin-cfg.xml file should now have a VirtualHostGroup and UriGroup for vhost1 with a Route that points to cluster1. Also there should be a VirtualHostGroup and UriGroup for vhost2 with a Route that points to cluster2.


You need to account for these new hostnames in my IBM HTTP Server config (httpd.conf). The ServerName for IBM HTTP Server is ihsbox. Create a VirtualHost in IBM HTTP Server to account for the other valid hostnames, like this:


ServerName ihsbox

ServerAlias host1

ServerAlias host2


Add host1 and host2 into my DNS config so that they resolve to the ip address of ihsbox.


Now, this URL http://host1/snoop will go to the snoop application in cluster1.


And, this URL http://host2/snoop will go to the snoop application in cluster2.


If you want to use different port numbers instead of different hostnames, the same idea applies there as well.


Jython Script to check the status of listener ports of all servers of cluster


lineSeparator = java.lang.System.getProperty('line.separator')


clusterName='CLUSTER_NAME'

cId = AdminConfig.getid("/ServerCluster:"+ clusterName +"/" )

cList = AdminConfig.list("ClusterMember", cId ).split(lineSeparator)

for sId in cList:

server = AdminConfig.showAttribute(sId, "memberName" )

node = AdminConfig.showAttribute(sId, "nodeName" )

cell = AdminControl.getCell()


s1 = AdminControl.completeObjectName('cell='+ cell +',node='+node +',name='+ server +',type=Server,*')

if len(s1) > 0:

print server + " state is started"

else:

print server + " is down"


print "Server " + server + " has the following Listener Ports"

lPorts = AdminControl.queryNames('type=ListenerPort,cell='+ cell+',node='+ node +',process='+ server +',*')

lPortsArray = lPorts.split(lineSeparator)

for lPort in lPortsArray:

lpcfgId = AdminControl.getConfigId(lPort)

lpName = AdminConfig.showAttribute(lpcfgId, "name")

lpstate = AdminControl.getAttribute(lPort, 'started')

if lpstate == 'true':

print lpName + " is started "

else :

print lpName + " is stopped "


print ""

Useful One Liner scripts for WAS Administrator:-


1. AdminTask.reportConfiguredPorts() : Lists every server in your cell. Shows all the ports each server uses

2. AdminTask.reportConfigInconsistencies() : Checks the configuation repository and reports any structural inconsistencies

3. AdminApp.list() : Lists every application installed in your cell

4, AdminApp.view( 'appName' ) : Replace appName with one of the names returned by AdminApp.list(). The name must be surrounded by quotes

6. AdminTask.generateSecConfigReport() : Shows every setting related to security in your entire cell. Shows the current value of the setting. Shows the menu path through the Admin Console to that setting. The printout is a little confusing at first, but it is very useful once you get used to reading it.

7. AdminTask.createApplicationServer('Node1', '[-name serverNode1 ]') : Creates a new application server called "serverNode1" in a node called "Node1"

Tuesday, October 9, 2012

Unix script to monitor TCP port statistics

One simple and very useful indicator of process health and load is its TCP activity. The following script takes a set of ports and summarizes how many TCP sockets are established, opening, and closing for each port. It has been tested on Linux and AIX. Example output:


$ portstats.sh 80 443

PORT ESTABLISHED OPENING CLOSING

80 3 0 0

443 10 0 2

====================================

Total 13 0 2 portstats.sh:


#!/bin/sh


usage() {

echo "usage: portstats.sh PORT_1 PORT_2 ... PORT_N"

echo " Summarize network connection statistics coming into a set of ports."

echo ""

echo " OPENING represents SYN_SENT and SYN_RECV states."

echo " CLOSING represents FIN_WAIT1, FIN_WAIT2, TIME_WAIT, CLOSED, CLOSE_WAIT,"

echo " LAST_ACK, CLOSING, and UNKNOWN states."

echo ""

exit;

}


NUM_PORTS=0

OS=`uname`


for c in $*

do

case $c in

-help)

usage;

;;

--help)

usage;

;;

-usage)

usage;

;;

--usage)

usage;

;;

-h)

usage;

;;

-?)

usage;

;;

*)

PORTS[$NUM_PORTS]=$c

NUM_PORTS=$((NUM_PORTS + 1));

;;

esac

done


if [ "$NUM_PORTS" -gt "0" ]; then

date

NETSTAT=`netstat -an
grep tcp`

i=0

for PORT in ${PORTS[@]}

do

if [ "$OS" = "AIX" ]; then

PORT="\.$PORT\$"

else

PORT=":$PORT\$"

fi

ESTABLISHED[$i]=`echo "$NETSTAT"
grep ESTABLISHED
awk '{print $4}'
grep "$PORT"
wc -l`

OPENING[$i]=`echo "$NETSTAT"
grep SYN_
awk '{print $4}'
grep "$PORT"
wc -l`

WAITFORCLOSE[$i]=`echo "$NETSTAT"
grep WAIT
awk '{print $4}'
grep "$PORT"
wc -l`

WAITFORCLOSE[$i]=$((${WAITFORCLOSE[$i]} + `echo "$NETSTAT"
grep CLOSED
awk '{print $4}'
grep "$PORT"
wc -l`));

WAITFORCLOSE[$i]=$((${WAITFORCLOSE[$i]} + `echo "$NETSTAT"
grep CLOSING
awk '{print $4}'
grep "$PORT"
wc -l`));

WAITFORCLOSE[$i]=$((${WAITFORCLOSE[$i]} + `echo "$NETSTAT"
grep LAST_ACK
awk '{print $4}'
grep "$PORT"
wc -l`));

WAITFORCLOSE[$i]=$((${WAITFORCLOSE[$i]} + `echo "$NETSTAT"
grep UNKNOWN
awk '{print $4}'
grep "$PORT"
wc -l`));


TOTESTABLISHED=0

TOTOPENING=0

TOTCLOSING=0

i=$((i + 1));

done


printf '%-6s %-12s %-8s %-8s\n' PORT ESTABLISHED OPENING CLOSING

i=0

for PORT in ${PORTS[@]}

do

printf '%-6s %-12s %-8s %-8s\n' $PORT ${ESTABLISHED[$i]} ${OPENING[$i]} ${WAITFORCLOSE[$i]}

TOTESTABLISHED=$(($TOTESTABLISHED + ${ESTABLISHED[$i]}));

TOTOPENING=$(($TOTOPENING + ${OPENING[$i]}));

TOTCLOSING=$(($TOTCLOSING + ${WAITFORCLOSE[$i]}));

i=$((i + 1));

done


printf '%36s\n'
tr " " "="

printf '%-6s %-12s %-8s %-8s\n' Total $TOTESTABLISHED $TOTOPENING $TOTCLOSING


else

usage;

fi

To automatically read the ports for IHS, use:


$ portstats.sh `grep Listen /opt/IBM/HTTPServer/conf/httpd.conf
grep -v "\#"
awk '{print $2}'
tr '\n' ' '`It should also be possible to extract WAS ports from .../WebSphere/AppServer/profiles/*/config/cells/*/nodes/*/serverindex.xml.

Moving WebSphere dmgr from one host to another

Steps involved in moving WebSphere dmgr from one host (machine1) to another host (machine2) with the hostname change :

1) As a caution make please make a backup of the following so that it's easy to restore when something goes wrong,

a) Backup the configuration of all the profiles (DMGR) and (AppSrv) in machine1 that is involved in the cell .

(eg) basically run WAS_ROOT/bin/backupconfig.sh which will create WebSphereConfig_2007-11-16.zip

b) (Optional) Also do a filesystem backup of the directory if possible to avoid any surprises.


2) Install WebSphere ND in the new box and create a new Dmgr profile with machine2_dmgr_profile .


3) Extract the WebSphereConfig_2007-11-16.zip to /config directory.

(eg) jar -xvf WebSphereConfig_2007-11-16.zip


4) if is different than than change USER_INSTALL_ROOT "value" in /config/cells//nodes//variables.xml to point to the new dmgr profile location.

(eg)


5) Change the following properties in /bin/setupcmdLine.sh to point to the machine1 dmgr cell name and node name.


(eg) WAS_CELL=machine1Cell01

WAS_NODE=machine1CellManager01


6) Copy the custom keyfiles (*.jks) from /etc/ to /etc; or skip this step if dmgr is using the default keys.


7) Follow the instructions mentioned in http://www-1.ibm.com/support/docview.wss?rs=180&context=SSEQTP&q1=best+practices&uid=swg27007419&loc=en_US&cs=utf-8&lang=en from page 4-6 on section 2 and 2.1


8) check if syncs works for all the nodes and you were able to see all the configurations from the previous dmgr.


Certificate Chk Scripts

################## cert_checker #############################


#


#

# Usage

# 1 - Copy to was users ~

# 2 - find out locations of keystores

# 3 - find out keystore passwords - these will be in the properties directory in ssl.client.props

# 4 - run script with following syntax ./certcheck.sh directoryname keystore_password eg

# ./certcheck.sh/wload/w6fc/app/profiles/base/config/cells/WLTHDR password01

#

####################################################################


rm ~/certlist.txt

fname=listcerts.tmp

pname=listcerts.tmp

directory=$1

password=$2

for a in `ls $directory/*jks $1/*kdb $1/*p12`

do

echo "" >> ~/certlist.txt

echo "################ private certificates #######################" >> ~/certlist.txt

echo $a >> ~/certlist.txt

/usr/opt/ibm/gskta/bin/gsk7cmd -cert -list personal -pw $password -db $a 2>>/dev/null
grep -v Certificates >${fname}

while read b

do

echo "######" >> ~/certlist.txt

/usr/opt/ibm/gskta/bin/gsk7cmd -cert -details -pw $password -db $a -label "$b" 2>>/dev/null >> ~/certlist.txt

done <${fname}

echo "#######################################"

done


for a in `ls $directory/*jks $1/*kdb $1/*p12`

do

echo "" >> ~/certlist.txt

echo "################ public certificates #######################" >> ~/certlist.txt

echo $a >> ~/certlist.txt

/usr/opt/ibm/gskta/bin/gsk7cmd -cert -list CA -pw $password -db $a 2>>/dev/null
grep -v Certificates >${pname}

while read c

do

echo "######" >> ~/certlist.txt

/usr/opt/ibm/gskta/bin/gsk7cmd -cert -details -pw $password -db $a -label "$c" 2>>/dev/null >> ~/certlist.txt

done <${pname}

echo "#######################################"

done


rm ${fname}

rm ${pname}

Thursday, September 27, 2012

password recovery from stash file

----------------unstash.pl begin ------------------------
use strict;

die "Usage: $0 \n" if $#ARGV != 0;

my $file=$ARGV[0];
open(F,$file) || die "Can't open $file: $!";

my $stash;
read F,$stash,1024;

my @unstash=map { $_^0xf5 } unpack("C*",$stash);

foreach my $c (@unstash) {
    last if $c eq 0;
    printf "%c",$c;
}
printf "\n";
---------------------unstash.pl end-----------------

perl unstash.pl key.sth
where key.sth is the stash file.


I explained it and created a Java version of this (Java is always available. Perl not)

http://strelitzia.net/wp/blog/2009/03/08/unstash-in-java/ 

Useful Unix File Finding Commands

Following are some bunch of commands that might be useful if you want to find files in unix/linux.

Large Files

Find files larger than 10MB in the current directory downwards…
find . -size +10000000c -ls
Find files larger than 100MB…
find . -size +100000000c -ls

Old Files

Find files last modified over 30days ago…
find . -type f -mtime 30 -ls
Find files last modified over 365days ago…
find . -type f -mtime 365 -ls
Find files last accessed over 30days ago…
find . -type f -atime 30 -ls
Find files last accessed over 365days ago…
find . -type f -atime 365 -ls

Find Recently Updated Files

There have been instances where a runaway process is seemingly using up any and all space left on a partition. Finding the culprit file is always useful.
If the file is being updated at the current time then we can use find to find files modified in the last day…
find  . -type f -mtime -1 -ls
Better still, if we know a file is being written to now, we can touch a file and ask the find command to list any files updated after the timestamp of that file, which will logically then list the rogue file in question.
touch testfile
find .  -type f -newer testfile -ls

Finding tar Files

A clean up of redundant tar (backup) files, after completing a piece of work say, is sometimes forgotten. Conversely, if tar files are needed, they can be identified and duly compressed (using compress or gzip) if not already done so, to help save space. Either way, the following lists all tar files for review.
find . -type f -name "*.tar" -ls
find . -type f -name "*.tar.Z" -ls

Large Directories

List, in order, the largest sub-directories (units are in Kb)…
du -sk * | sort -n
Sometimes it is useful to then cd into that suspect directory and re-run the du command until the large files are found.

Removing Files using Find

The above find commands can be edited to remove the files found rather than list them. The “-ls” switch can be changed for “-exec rm {}\;”=.
e.g.
find . -type f -mtime 365 -exec rm {} \;
Running the command with the “-ls” switch first, is always prudent to see what will be removed.
The “-ls” switch prints out summary information about the file (like owner and permissions). If just the filename is required then swap “-ls” switch for “-print”.
Are you using different commands to find a file? Please share it using below comment form. :)

Wednesday, June 13, 2012

WebSphere OutOfMemory Errors


WebSphere OutOfMemory Errors


If your WAS deployment is experiencing OOM issues you can setup the JVM to produce a system dump when the OOM event occurs. This system dump can later be jextracted and sucked into Eclipse Memory Analyzer to do offline analysis.
There are a variety of ways to obtain a dump from the IBM software development kit and various formats for the dump produced. It important to understand the content of each of the dumps so that the correct one can be selected for analysis of a given problem. In essence there are three forms of dump:

  • A system dump which is a complete dump of all the information in a process. The Dump Analyzer requires this form of dump to perform analysis. 
  • A heap dump which gives a more terse view of the objects in the heap but does not include thread and monitor information. This form of dump is of use to other tools for heap analysis. 
  • A summary dump sometimes called a javacore file. This is a human readable dump designed to summarise the state of the process in high level terms; the threads, monitors etc. 
Dumps are produced by the JVM either on demand (a signal from the user) or on event (something happening within the VM). When the JVM starts it registers a number of event handlers which cause dumps to be generated for a default set of events. In the case of an Out of Memory event a heap dump is generated, for a user signal a javacore is generated and for a JVM crash a system dump is generated. For detailed information on setting the JVM options that control dump production.

To generate a system dump automatically on an OOM you will need to set the following  JVM generic argument:-Xdump:system:events=systhrow,filter=java/lang/OutOfMemoryError,request=nodumps+exclusive+prepwalk

In order to generate java core dump, system core dump, heap dump and a snap dump at user signal, the dump agents must be configured through JVM options as follows.-Xdump:java+heap+system+snap:events=user


You can have multiple -Xdump options on the command line. 
-Xdump agents are always merged internally by the JVM, as long as none of the agent settings conflict with each other.
 

-Xdump:java+heap+system+snap:events=user -Xdump:system:events=systhrow,filter=java/lang/OutOfMemoryError,request=nodumps+exclusive+prepwalk

-X options are specified as generic JVM arguments on WebSphere Application Server 6.1 as follows:
In the Administration Console select Servers
  1. Select Application Servers
  2. Click on the name of your server
  3. In the Server Infrastructure section, expand Java and Process Management and select Process Definition > Java Virtual Machine
  4. Scroll down and locate the textbox for Generic JVM arguments.
Please also see Crash on AIX produces no core or a truncated core   to prevent a truncated core from being generated on AIX. 

Please note these events ONLY work for IBM Java5 and Java6 JVMs. 
Happy debugging :-)

Friday, May 18, 2012

WebSphere troubleshooting concepts

WebSphere troubleshooting

  1. Have an end-to-end view in WebSphere troubleshooting, from browser all the way to the backend system.
  2. First, test JVM to see if it is working. Make sure that the JVM is up and running and there is no hang thread. Turn on verbose GC and look into system log and native_std.log for JVM related error message.
  3. From the browser, to be if the URL is working. If the return code is 500 internal error, this may be a JVM or plugin issue. If the return code is 404 page not found error, it may well be a web server problem. 
  4. Try to browse into the transport port of the web server and application server directly. If there URL works, then, you can exclude the web server and application server from the troubleshooting scope.
  5. Use "telnet server_name port_name"   to test network connectivity and server status or test other components of the system, for example MQ server with a port number of 1470.
  6. Look into the access log of the web server to see if any request has actually made to the web sever and not got stuck with the 3DNS or BIG IP. Also look into error logs to see if there are any plugin problems and SITEMINDER issues.
  7. If there is high CPU, usually it is bad application code.
  8. If there is high memory consumption, create heap dump with kill -3 helps. You can ship the dump to IBM for analysis if your work station does not have enough memory to run the Support Assistance suite of tools.
  9.  Check connection pool - a frequently seen problem is a bug in the JEE code that does not close the connection after using. This causes a connection leak. Use "telnet server_name 446" to examine the network connectivity between the WebSphere Application Server and the backend systems. This will also tell you if the server is actually up and running. Sometimes, the piling up of connections is due to a connectivity issue. Use TPV, Introscope, or ITCAM to inspect the connection pool as well as examine system log for connection timeout. 
  10. It helps tremendously if you have transaction monitoring capability.  Then, you know exactly where the transaction got stuck or slows down. Introscope provides this capability, though you need in-depth expertise in Introscope that takes time to build.
  11. The capability to monitor user experience and transaction is critical in troubleshooting.